Bush School IDMD Spring Semester 2021
Lesson Plan
Week of Feb 22nd
Introduction
- Update on Exercises, Projects and Grading
- How do we catch-up?
- You will have 2 weeks for the visualization assignment. We will do a similar assignment together.
Warmup
Online book Getting Started with P5JS
- Open your local copy you have previoosly downloaded to yout laptop. If not download above and open locally.
- Chapter 4 - Repetition
Lessons
- Introduce for and while loops
- Syntax
- When to use one over the other
-
Vocabulary, order, forward and backward
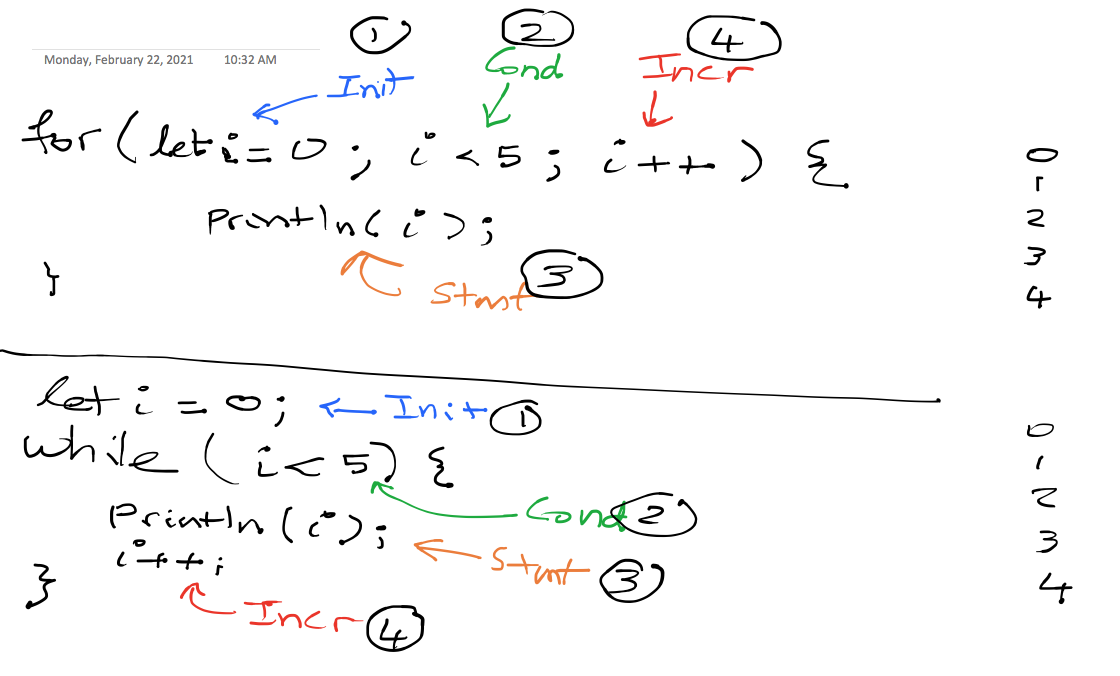
- for Loop
-
Mouse Lines
  function setup() {
      createCanvas(400, 400);
      strokeWeight(4);
  }

  function draw() {
      background(204);

      for(let i = 10; i < mouseX; i = i + 8){
          line(i, 0, i, 390);
      }
  }
-
- while Loop
-
Concentric Circles
let dia = 10;
function setup() {
    createCanvas(400, 400);
    background(212);
    noFill();
}

function draw() {
  while (dia < width) {
    ellipse(width / 2, height / 2, dia, dia);
    dia += 10;
  }
}
-
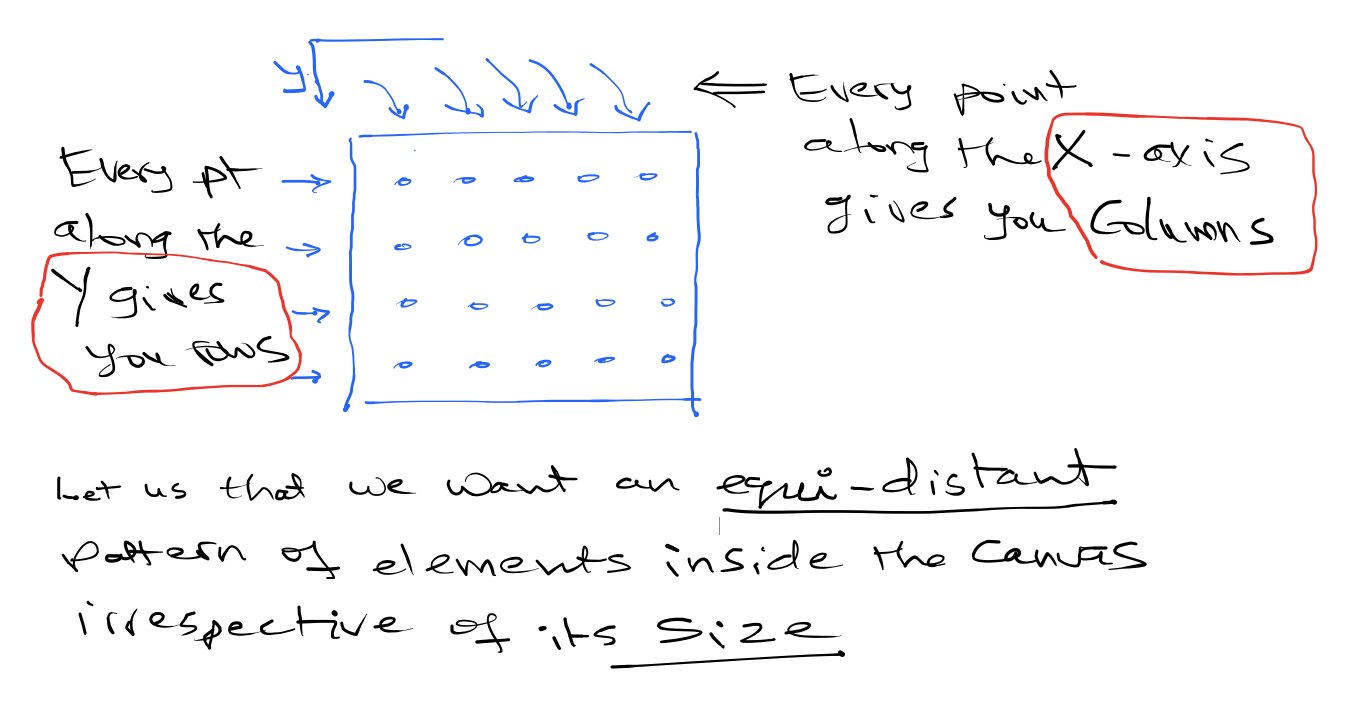
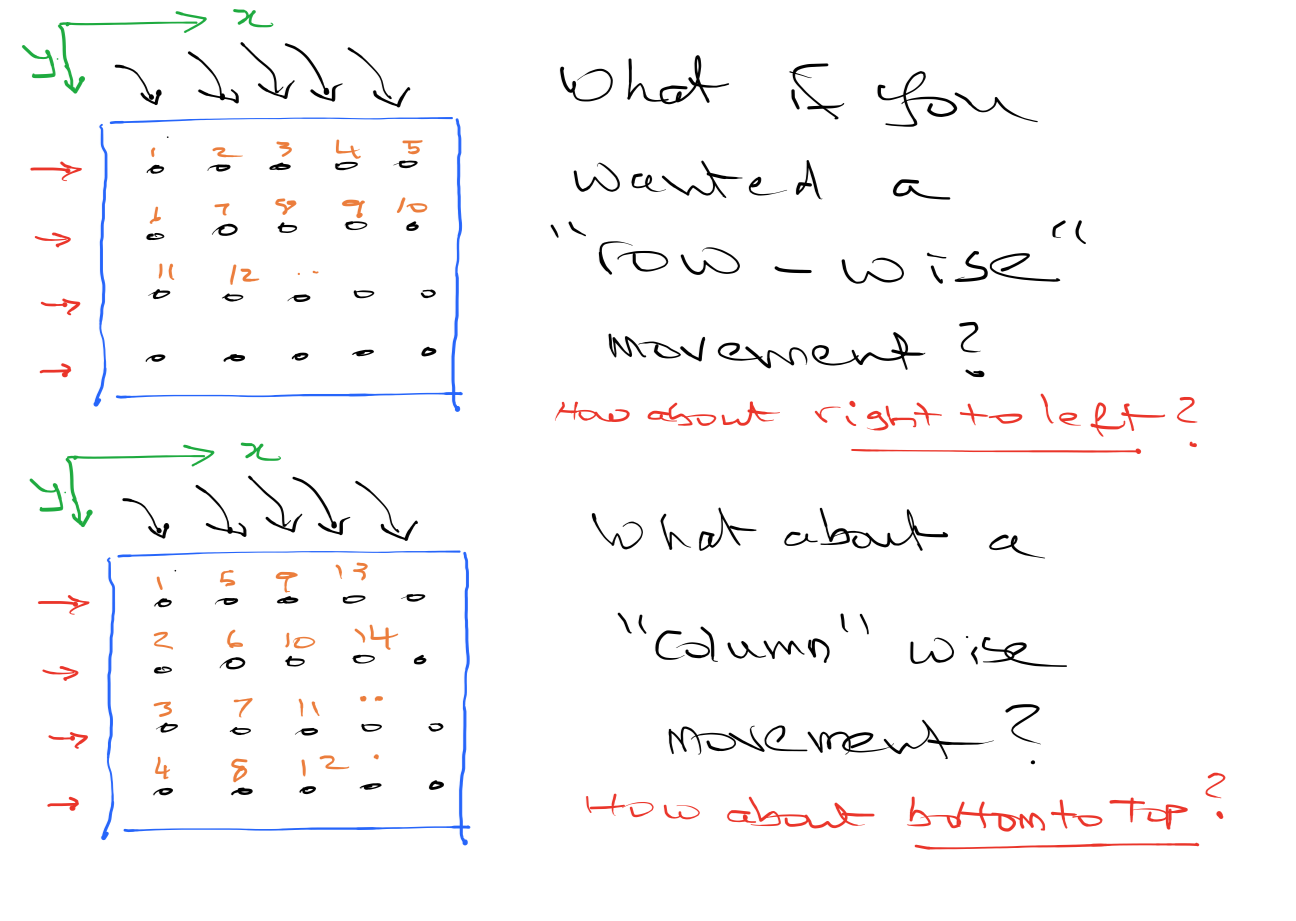
- Nested Loops
-
Dot Grid
  function setup() {
      createCanvas(400, 400);
  }

  function draw() {
      for(let y = 20; y < height - 20; y = y + 5){
          for(let x = 20; x < width - 20; x = x + 5){
              point(x,y);
          }
      }
  }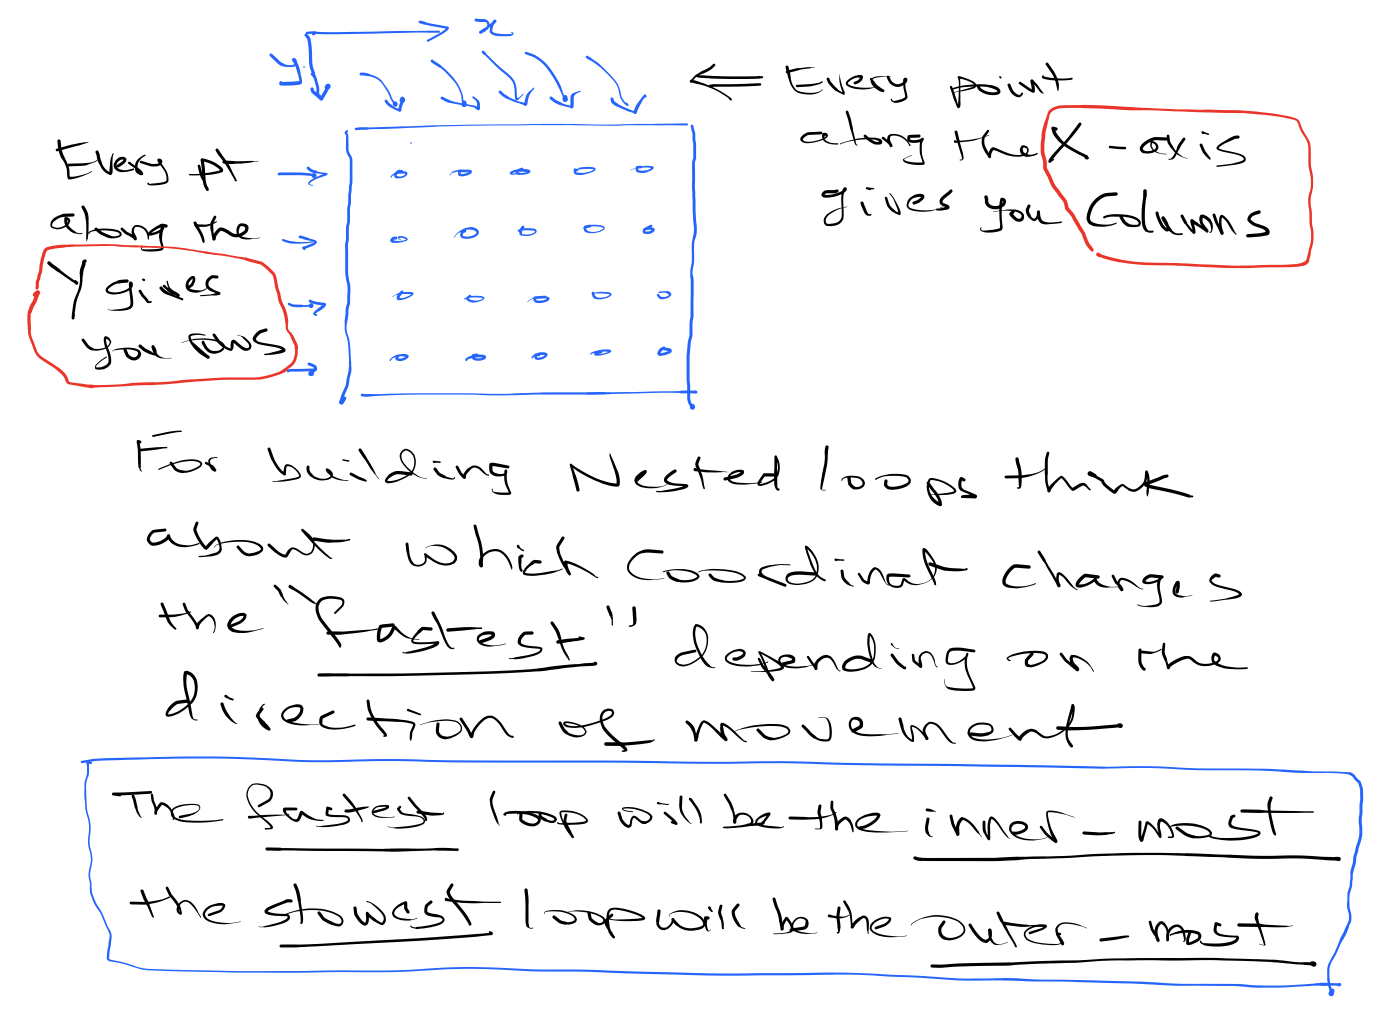
-
- Introduce arrays
- Arrays+For loops love each other
- Object that stores many values, but only 1 name
- Share common example: temp
- Groups related data together
- Items in an array are called elements
- Creating
- Indexes start at 0
- Accessing elements
- Modifying a value
Birthday Visualization
- Show working version
- Talk about current version
- Talk about returning a value
- Finish solution together as a class
/*  Created by susan evans
    Modified by Chandru Narayan
    Last edited 02/21/2021
    This program displays a visualizations of the most popular
    birthdays of the year.

    INCOMPLETE VERSION
*/

// ranks by day of the year (out of 365)
// Data from 2016 (leap year); source unknown
let rank = [364, 362, 356, 350, 338, 301, 324, 347, 351, 349, 341, 306, 316, 260, 304, 322, 337, 317, 302, 240, 279, 271, 294, 333,
  299, 298, 262, 280, 285, 314, 343, 330, 253, 256, 281, 287, 293, 332, 308, 245, 171, 214, 166, 331, 103, 248, 244, 232,
  237, 246, 206, 292, 218, 213, 157, 204, 203, 247, 250, 366, 235, 189, 133, 150, 156, 228, 290, 265, 268, 195, 163, 165,
  334, 300, 264, 208, 134, 152, 198, 202, 254, 261, 255, 210, 162, 187, 225, 297, 275, 267, 227, 348, 193, 278, 277, 336,
  286, 226, 196, 274, 296, 335, 315, 346, 257, 223, 243, 309, 323, 339, 310, 259, 201, 230, 307, 325, 327, 313, 270, 282,
  288, 242, 305, 329, 291, 177, 181, 229, 276, 326, 273, 251, 175, 249, 174, 183, 272, 258, 188, 168, 123, 138, 141, 176,
  167, 311, 289, 211, 200, 234, 328, 319, 153, 121, 124, 146, 179, 197, 215, 191, 154, 120, 137, 170, 303, 169, 139, 117,
  107, 126, 140, 132, 145, 118, 110, 95, 100, 112, 129, 108, 101, 75, 50, 47, 127, 361, 321, 76, 14, 12, 37, 49, 90, 93, 99, 43,
  25, 40, 61, 91, 87, 51, 45, 18, 32, 72, 78, 80, 58, 35, 28, 39, 68, 86, 85, 66, 48, 36, 46, 60, 64, 77, 52, 56, 17, 67, 55, 71, 70, 54,
  33, 30, 31, 57, 82, 81, 63, 59, 38, 34, 44, 74, 73, 65, 106, 114, 92, 98, 125, 111, 105, 29, 2, 9, 24, 41, 69, 16, 8, 1, 4, 10, 13, 15,
  7, 5, 3, 6, 11, 27, 21, 23, 22, 19, 20, 53, 88, 89, 79, 83, 84, 97, 119, 122, 160, 136, 180, 116, 109, 155, 216, 239, 219, 159, 135,
  164, 212, 269, 209, 184, 172, 142, 173, 252, 355, 233, 222, 178, 131, 143, 207, 236, 241, 192, 182, 158, 194, 312, 263, 238,
  190, 161, 148, 147, 151, 199, 340, 344, 352, 353, 357, 358, 359, 345, 231, 149, 144, 186, 283, 320, 318, 284, 221, 217, 205,
  295, 266, 342, 185, 128, 102, 94, 96, 113, 104, 115, 224, 354, 363, 365, 360, 130, 62, 42, 26, 220, 67, 120, 200, 100, 35, 130
];

let numColors = 160;
let rectWidth = 40;
let rectHeight = 20;
let gridOffset = 50;

function setup() {
  createCanvas(700, 800); // sets the canvas size to 700 x 800
}

function draw() {
  background(250, 182, 182); // clears the background
  drawGrid(); // draws the gridlines
  drawLabels(); // draws the graphs labels
  displayValues(); // calls dispaly values, which will show values on hover
}

// Draws the day, and month labels
// and the labels for the gradient key
// as well as the gradient key itself
function drawLabels() {
  noStroke();
  // day labels
  textSize(11);
  for (let i = 0; i < 31; i++) {
    text(i + 1, 65, 82 + i * 20);
  }
  // month labels
  text('   Jan        Feb      Mar       Apr        May     June      July       Aug      Sept      Oct       Nov      Dec', 90, 65);

  // labels for keys
  text('More Common', 165, 730);
  text('Less Common', 420, 730);
  // gradient key
  for (let i = 0; i < numColors; i++) {
    stroke(200 - i, 200 - i, 200 - i);
    line(250 + i, 710, 250 + i, 740);
  }
}

// draws the grid of rectangles
function drawGrid() {
  noStroke();
  for (let i = 0; i <= 365; i++) {
    fill(rank[i] * numColors / 366, rank[i] * numColors / 366, rank[i] * numColors / 366);
    rect(gridOffset + getMonth(i) * rectWidth, gridOffset + getDay(i) * rectHeight, rectWidth - 2, rectHeight - 2);
  }
}

// given the current index (out of 365)
// returns the month (1 based)
function getMonth(index) {
  let count = 0;
  let currentMonth = 1;
  while (count + getDaysInMonth(currentMonth - 1) <= index) {
    count = count + getDaysInMonth(currentMonth - 1);
    currentMonth++;
  }
  return currentMonth;
}

// given the current index (out of 365)
// returns the day (1 based)
function getDay(index) {
  let monthIndex = 0;
  let currentDay = 1;
  let count = 0;
  while (count < index) {
    if (currentDay == getDaysInMonth(monthIndex)) {
      monthIndex++;
      currentDay = 1;
    } else {
      currentDay++;
    }
    count++;
  }
  return currentDay;
}

// when the user hovers over a square
// it displays the actual rank of that day
function displayValues() {
  // determine where the mouse is hovering
  let monthIndex = (int)((mouseX - (gridOffset + rectWidth)) / rectWidth); // 90 is the starting point of the left-most rects
  let dayIndex = (int)((mouseY - (gridOffset + rectHeight)) / rectHeight); // 70 is the starting points of the left-most rects
  // if that mouse position is within the range of the data
  if (monthIndex >= 0 && monthIndex < 12 && dayIndex >= 0 && dayIndex < getDaysInMonth(monthIndex)) {
    // determine whether to show the text as black or white
    // 183 is about when we should switch to black
    if (rank[getNumDays(monthIndex) + dayIndex] > 183) {
      fill(0);
    } else {
      fill(255);
    }
    // display the actual rank
    textSize(20);
    text(rank[getNumDays(monthIndex) + dayIndex], mouseX, mouseY);
  }
}

// Given the current month (1-based)
// returns the total number of days up to and including the month specified
// so an input of 2 should give an output of the sum of the number of days
// in January (31) and the number of days in February (29).
// In other words getNumDays(2) => 31+29 = 60.
function getNumDays(monthIndex) {
// ADD CODE HERE
// RETURN SOMETHING HERE
  // this wil sum up the total number of days up to a specified month
  var dayOfYear = 0;
  // this is counting up how many months we have added in so far
  var count = 0;
  // loop from 0 up to the monthIndex that was passed
  for (let i = 0; i < monthIndex; i++) {
    // add the days in the current month to our day total
    dayOfYear = dayOfYear + getDaysInMonth(i);
  }
  // Send total number of days back to whichever method called it
  return dayOfYear;
}

// 31, 29, 31, 30, 31, 30, 31, 31, 30, 31, 30, 31
// takes in a month, zero based
// and returns the days in that month
// 0 is January, 11 is December
function getDaysInMonth(month) {
// ADD CODE HERE
// RETURN SOMETHING HERE
}